Azure AKS (Azure Kubernetes Cluster) is a serverless Kubernetes offer. Deploy and manage containerized applications more easily with a fully managed Kubernetes service.
Azure Kubernetes Service
Create your cluster
When you log into Azure Cloud you get a lot of possibilities and resources to play with. Almost everything can be done via the Azure Cloud Portal (a GUI), but that would be a very bad idea. The GUI is great to get a look at metrics, existing deployment or for testing around, however it is advised to use the command line as much as possible because more generic and reliable.
Creating a simple Kubernetes cluster with the az aks which is the Azure CLI:
az aks create --resource-group MyResourceGroup --name MyManagedCluster --node-count 2
That will create all the necessary infrastructure components you need for your cluster.
They will be referenced as resources in your Azure Dashboard and will be part of the MyResourceGroup which is the specify group.
The name of the cluster can’t be change later.

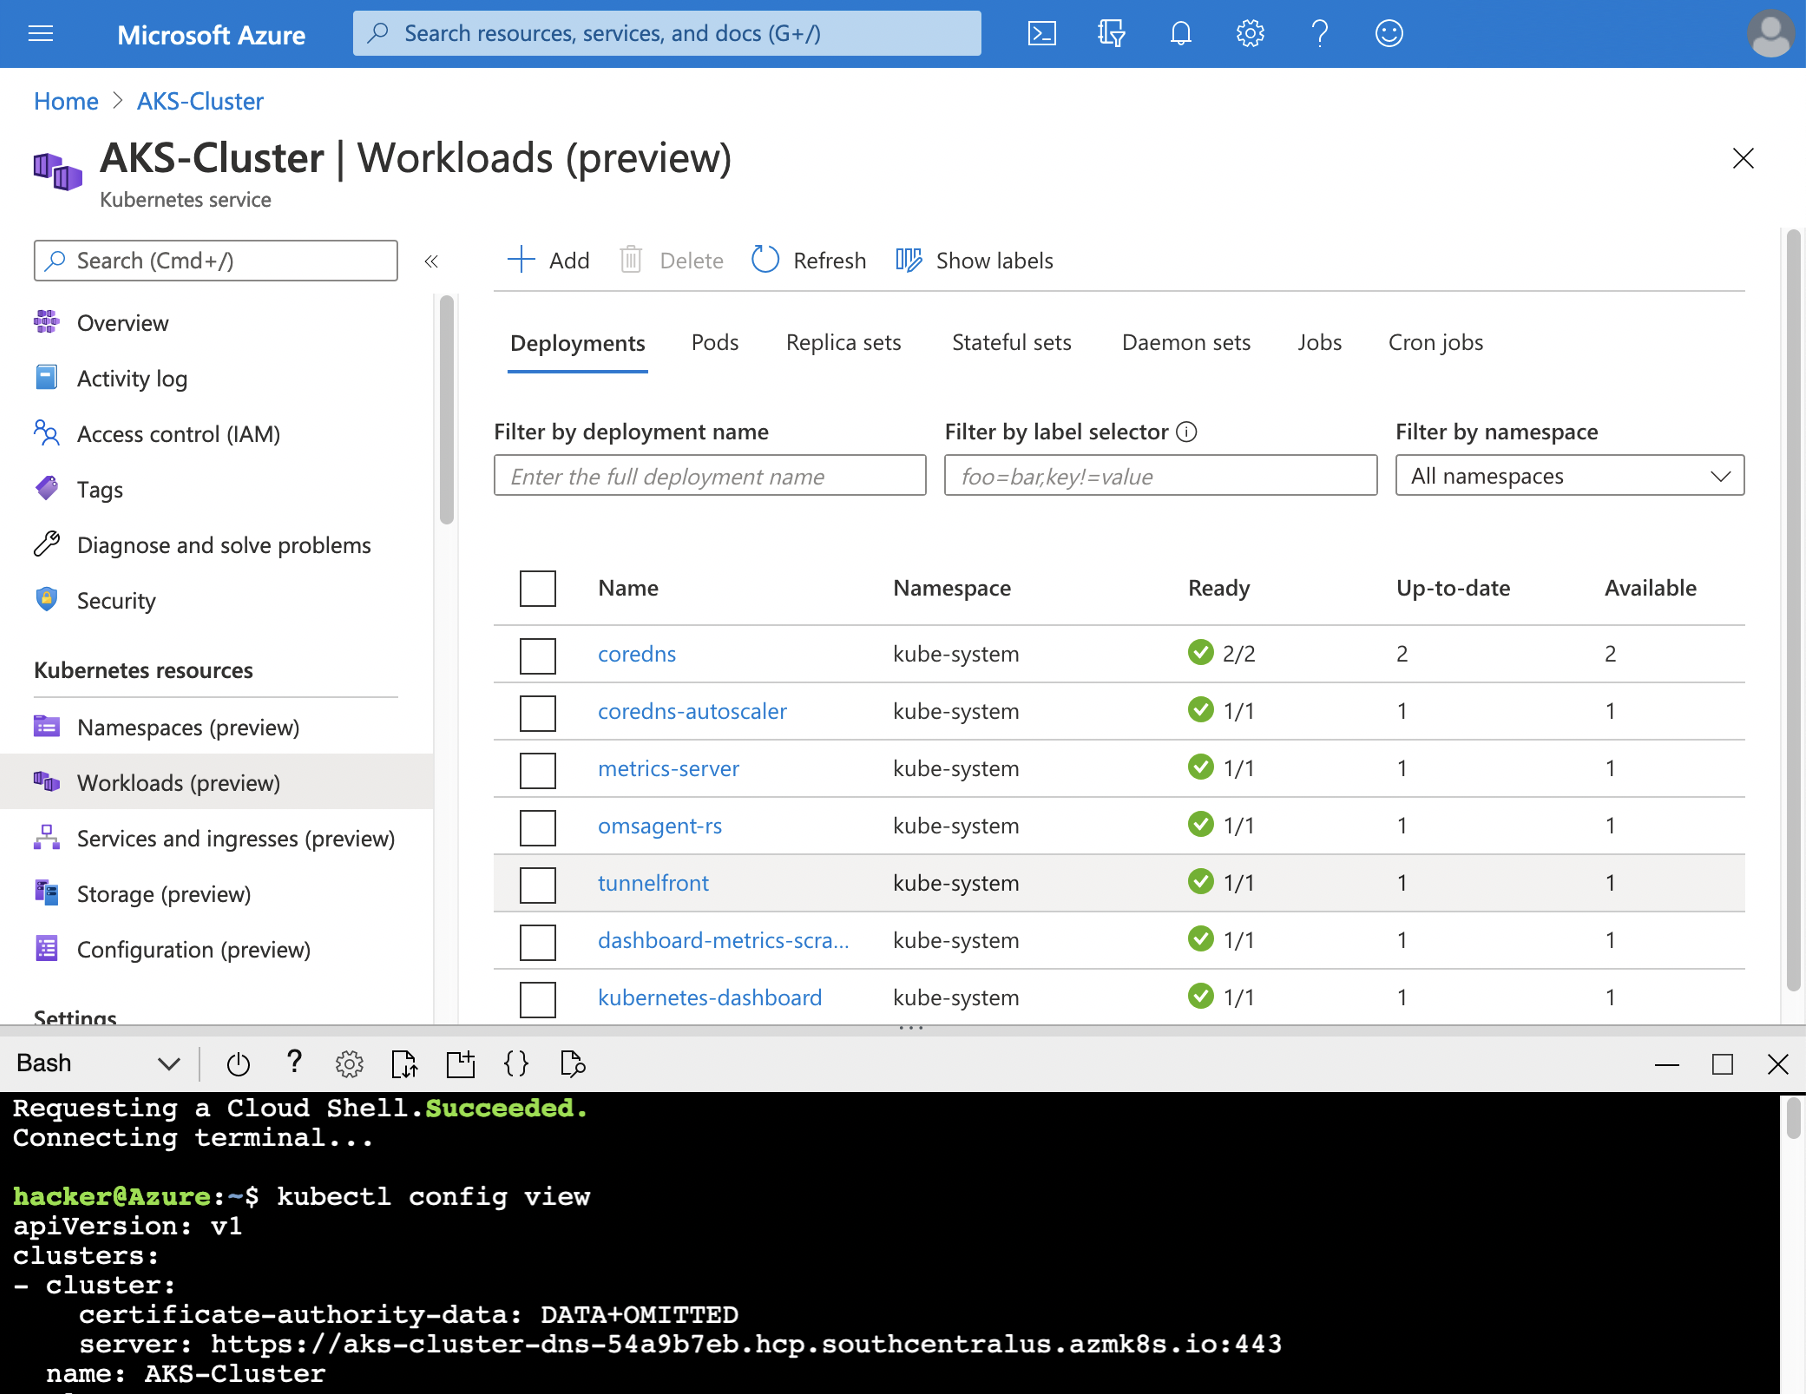
Once created (it can take a couple of minutes) you can access your Kubernetes cluster via your PC, or using the Azure Cloud Terminal (available as Bash or Powershell) with all the tools already installed.
Add RBAC with Azure AD
You can use Kubernetes role-based access control (Kubernetes RBAC) with an addition with the Azure Active Directory. That way you can fine tune what users can do within your cluster.
You can update your cluster with Azure Active Directory (aad) or create a new cluster. Here is how you should do to update your cluster with a newly created AD group:
# Create your AD Group
az ad group create --display-name myAKSAdminGroup --mail-nickname myAKSAdminGroup
az aks update -g MyResourceGroup -n MyManagedCluster --enable-aad --aad-admin-group-object-ids <id-1>
That step is not mandatory but good to know that it is possible to secure even further your cluster. One of the good point of Azure its all the possibility it provides, but it also be quiet complex to get a full understanding at the whole architecture and component in azure. You may need to get credentials so you can access your Kubernetes:
az aks get-credentials --resource-group MyResourceGroup --name MyManagedCluster
And then it should be all traditional Kubernetes/helm commands to update your cluster.
And that’s the good thing about it, you don’t need to learn new special commands to manage your cluster,
you can still use kubectl.
Get started with your Kubernetes Cluster
Create new deployment
Apply new deployment using yaml file instead of the GUI using:
kubectl apply -f deployment.yaml
If you are using an Azure registry to store your artifacts and docker images, you can use the Azure CLI
to attach it to your deployment using with azureRegistry the name of the registry:
az aks update --resource-group MyResourceGroup --name MyManagedCluster --attach-acr registryAzure
That way you can pull images from your own registry and have your pods created. Once done, it should also be all be visible in the GUI
View created resources on the Portal
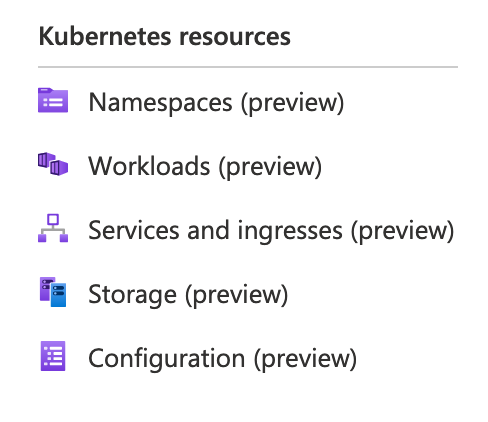
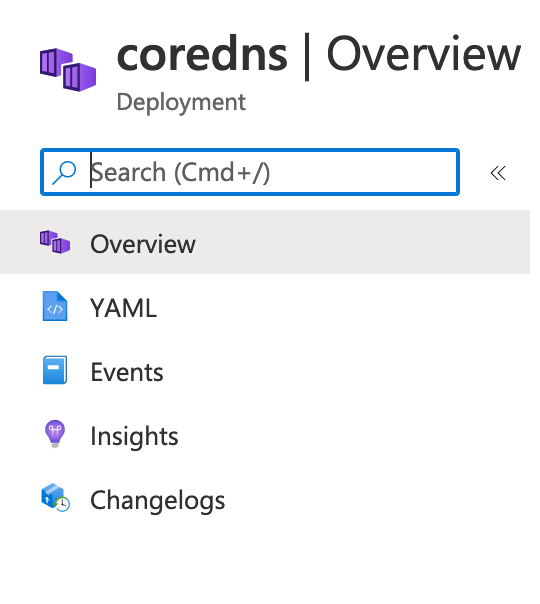
Talking about the GUI once you have some pods, services and else, you can click on kubernetes resources and select one. You then have some visualization options there on the side (Yaml, Events, Changelog)


All these info can be viewed with kubectl describe but it’s still cool to have it there as well.
In case you lost the file, or want to check the deployment from the GUI.
Also you will see that a lot of Azure stuff will be added to your deployment Yaml files (timestamp, uuid, …).
Add metrics for monitoring
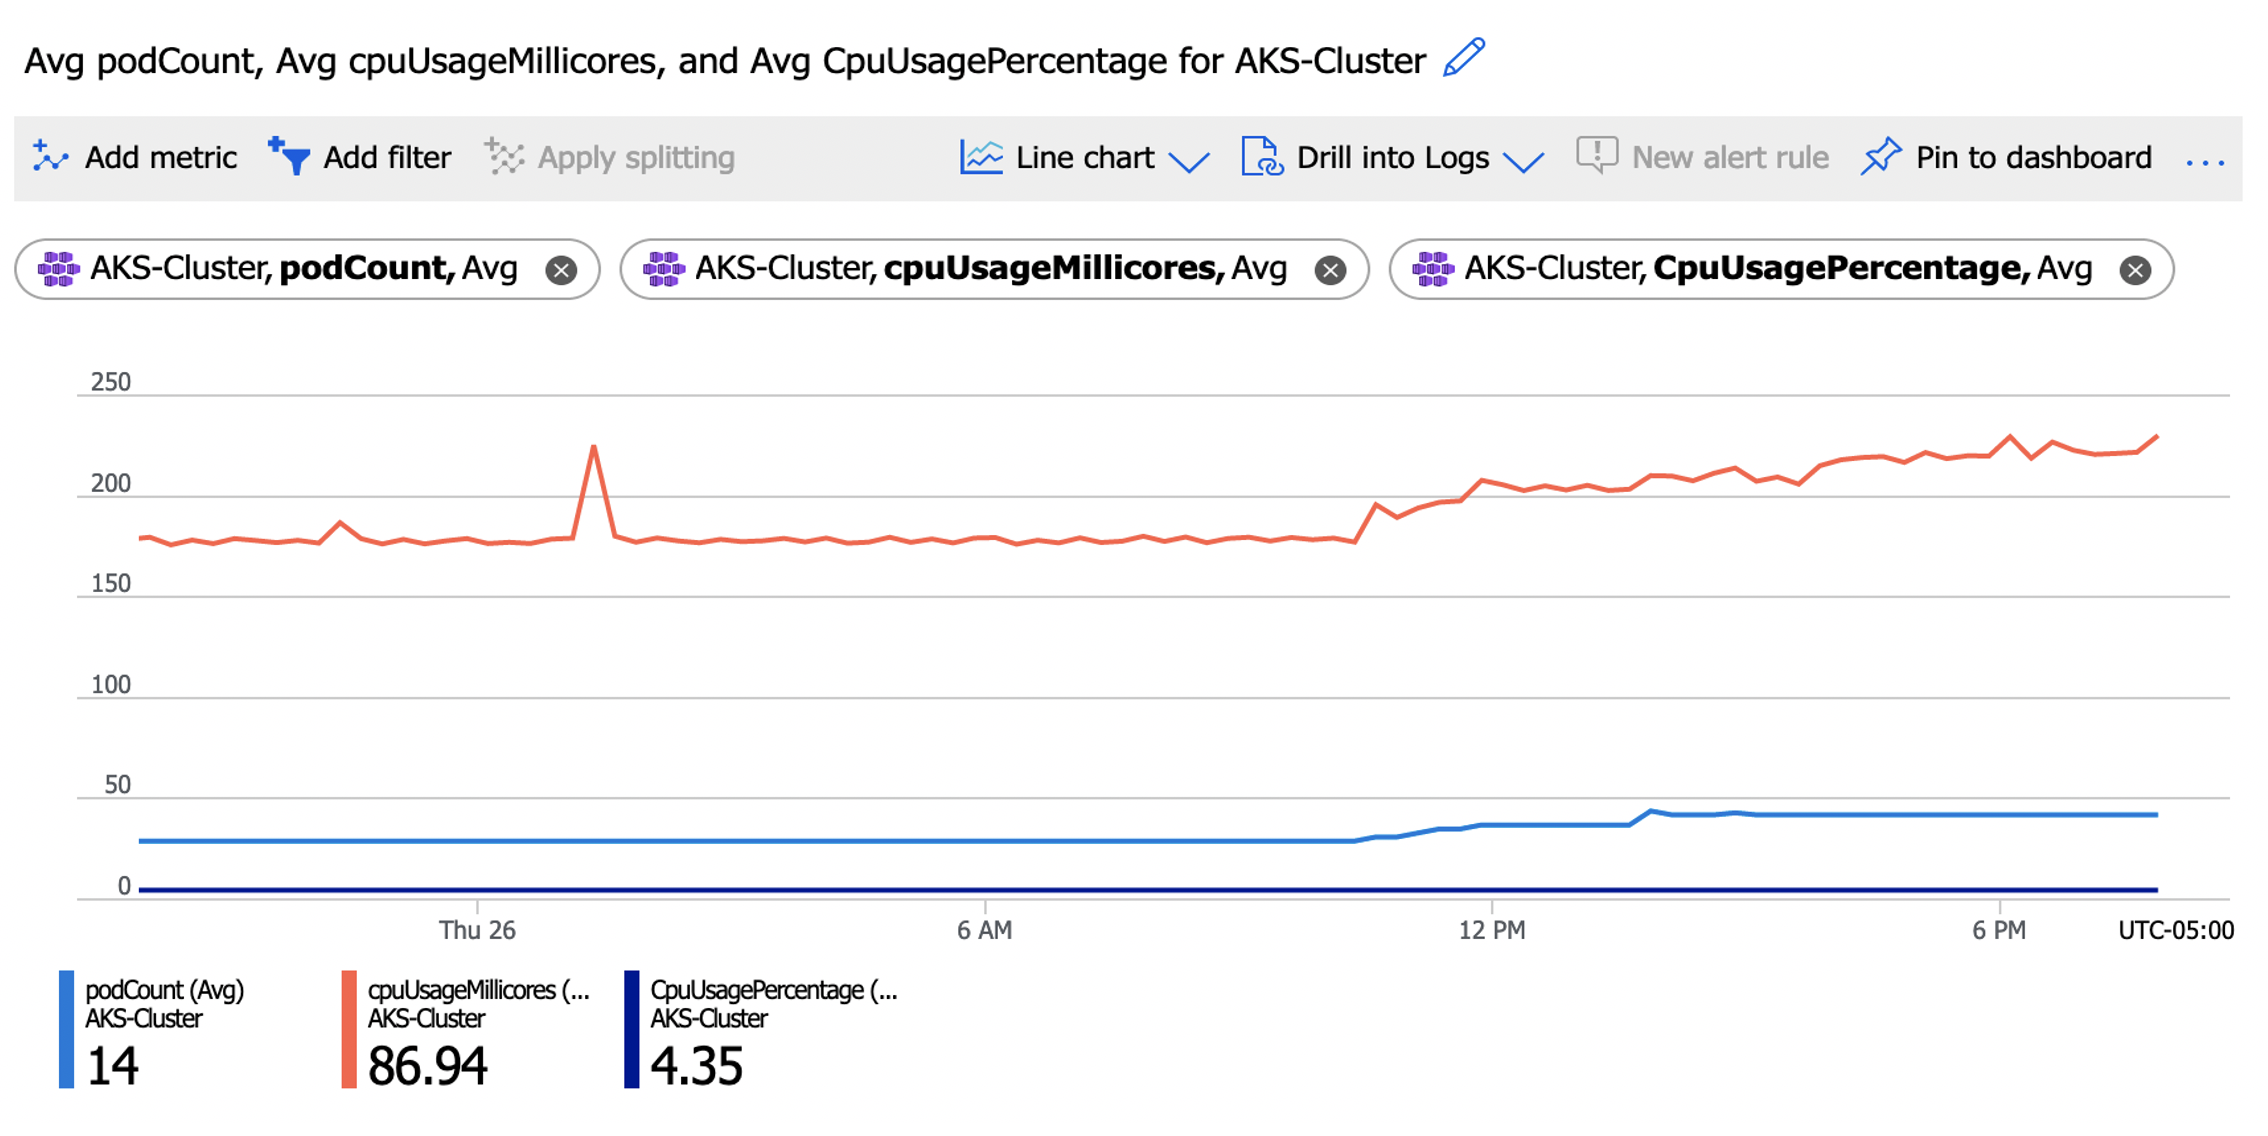
Once you have a couple pods, you can create default metrics charts from the Monitoring panel in your dashboard from your kubernetes cluster. It has basic pods and cpu information. Still on the monitoring side you have access to a broad range of features like Alerts, Logs, and other diagnostic tools.

But that’s not all, you can also configure a prometheus instance and plug it to your cluster for added functionality. For that you can use some prometheus exporters with a prometheus container or directly through the Azure Monitor so that you can scrap the metrics and display them.