Datadog is an observability service that basically ingest your services (apps, databases, servers) logs and display them in fancy dashboard where you can set metrics, alerting, custom diagrams, and more.
The part that I would like to go over is regarding the data collection, how it is parsed and how to leverage datadog’s capabilities to create your own log management pipelines.
Now with the formula Cloud Monitoring as a Service you don’t need to self-host datadog, you can onboard on a ready to use cloud hosted one.
Data collection
The data collection is done via an agent, datadog understands JSON well, so it’s better to format your logs that way, else each line will be understood as a separate datadog line.
For the configuration, you can modify the datadog agent configuration, but if you are aggregating from different apps and services, you can also do that from the app’s configuration. Datadog is already well integrated, and you will find some example in the language of your application that will make sure your logs well get processed correctly by datadog without any further configuration.
Else you will need to use the log management pipeline.
Log pipeline
Datadog automatically parses the JSON formatted logs, but you can use pipelines to process and add attributes to those logs. There is also some good practices and name convention to make your life easier. Processing those logs and extracting values allows you to create facets that you can use to search logs, add alerting, create dashboard from.
Name convention
Here are the reserved attributes that datadog will pre-process in your JSON logs, this is none exhaustive, just to give you an idea of the log configuration that is happening:
- Source: from
ddsourcewhich is the log’s source. - Host: from
hostorhostnamefor the host running the app. - Date: from
timestampwhich is the time the log was written. - Message: from
messageis shown as thecontentin the log explorer or in themessagepart at the top and not in in the event attribute. - Status: from
statusorlevelfor the log level (INFO, WARN, ERROR). - Service: from the
serviceattribute which should be the name of app. - Trace ID: from
dd.trace_idinjected by the datadog tracer.
Nested pipelines
You can create multiple pipeline and nested pipeline in datadog, see it has a filter you go from wider to small. Here is an example from the datadog documentation:
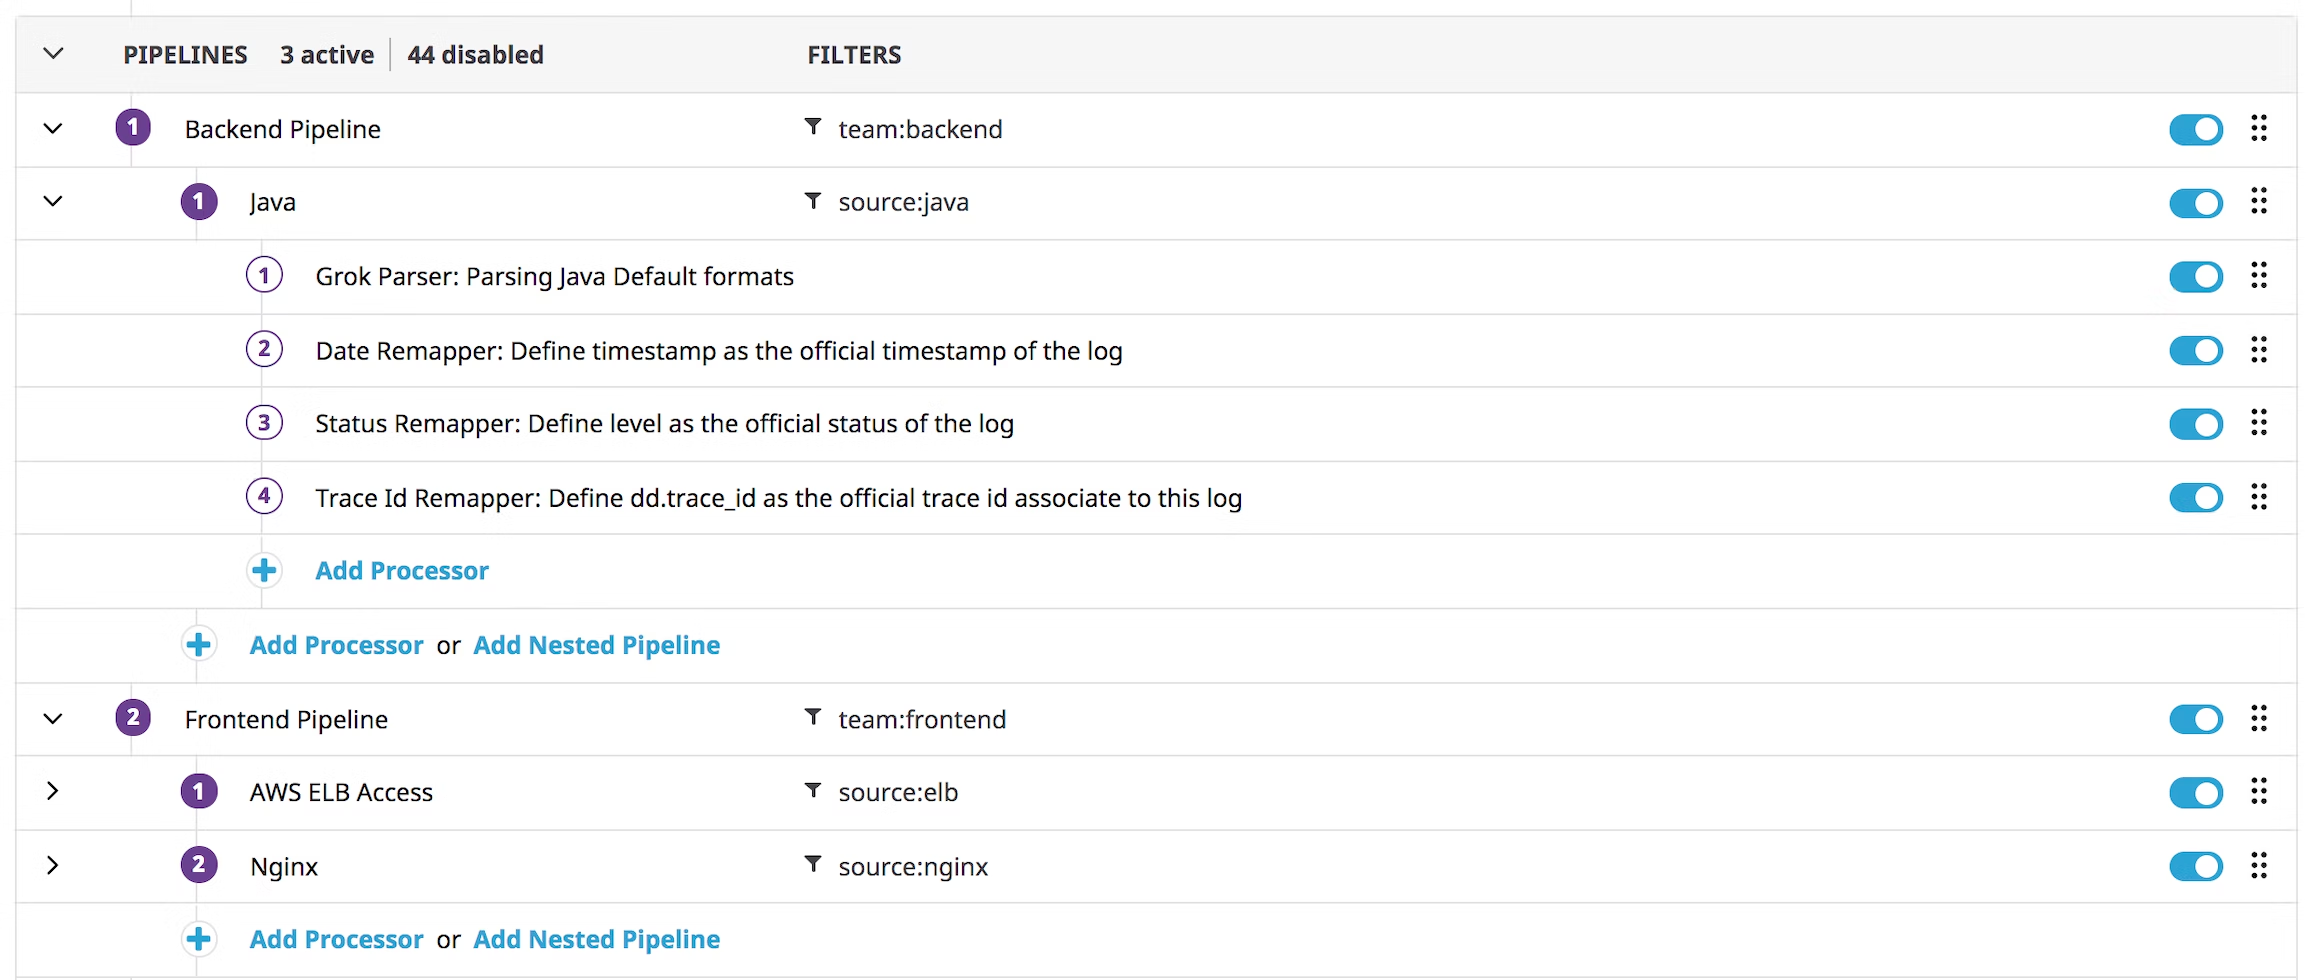
The first pipeline will take everything from the backend services, then it will have a nested pipeline to process the java logs, if you had a typescript application, you could add under the backend service pipeline another nested one to process those typescript logs as well.
Then you can se a frontend pipeline filtering on the frontend team (a custom attribute) with multiple nested pipeline filtered by source.
Processors
The processors can be added within a pipeline to process your data, they come in two main categories, the parser which will interpret and extract values within the log, and the remapper which will transform attributes in the JSON formatted logs.
Grok Parser
The Grok parser will parse the message to extract specific attributes of your event with a matcher:
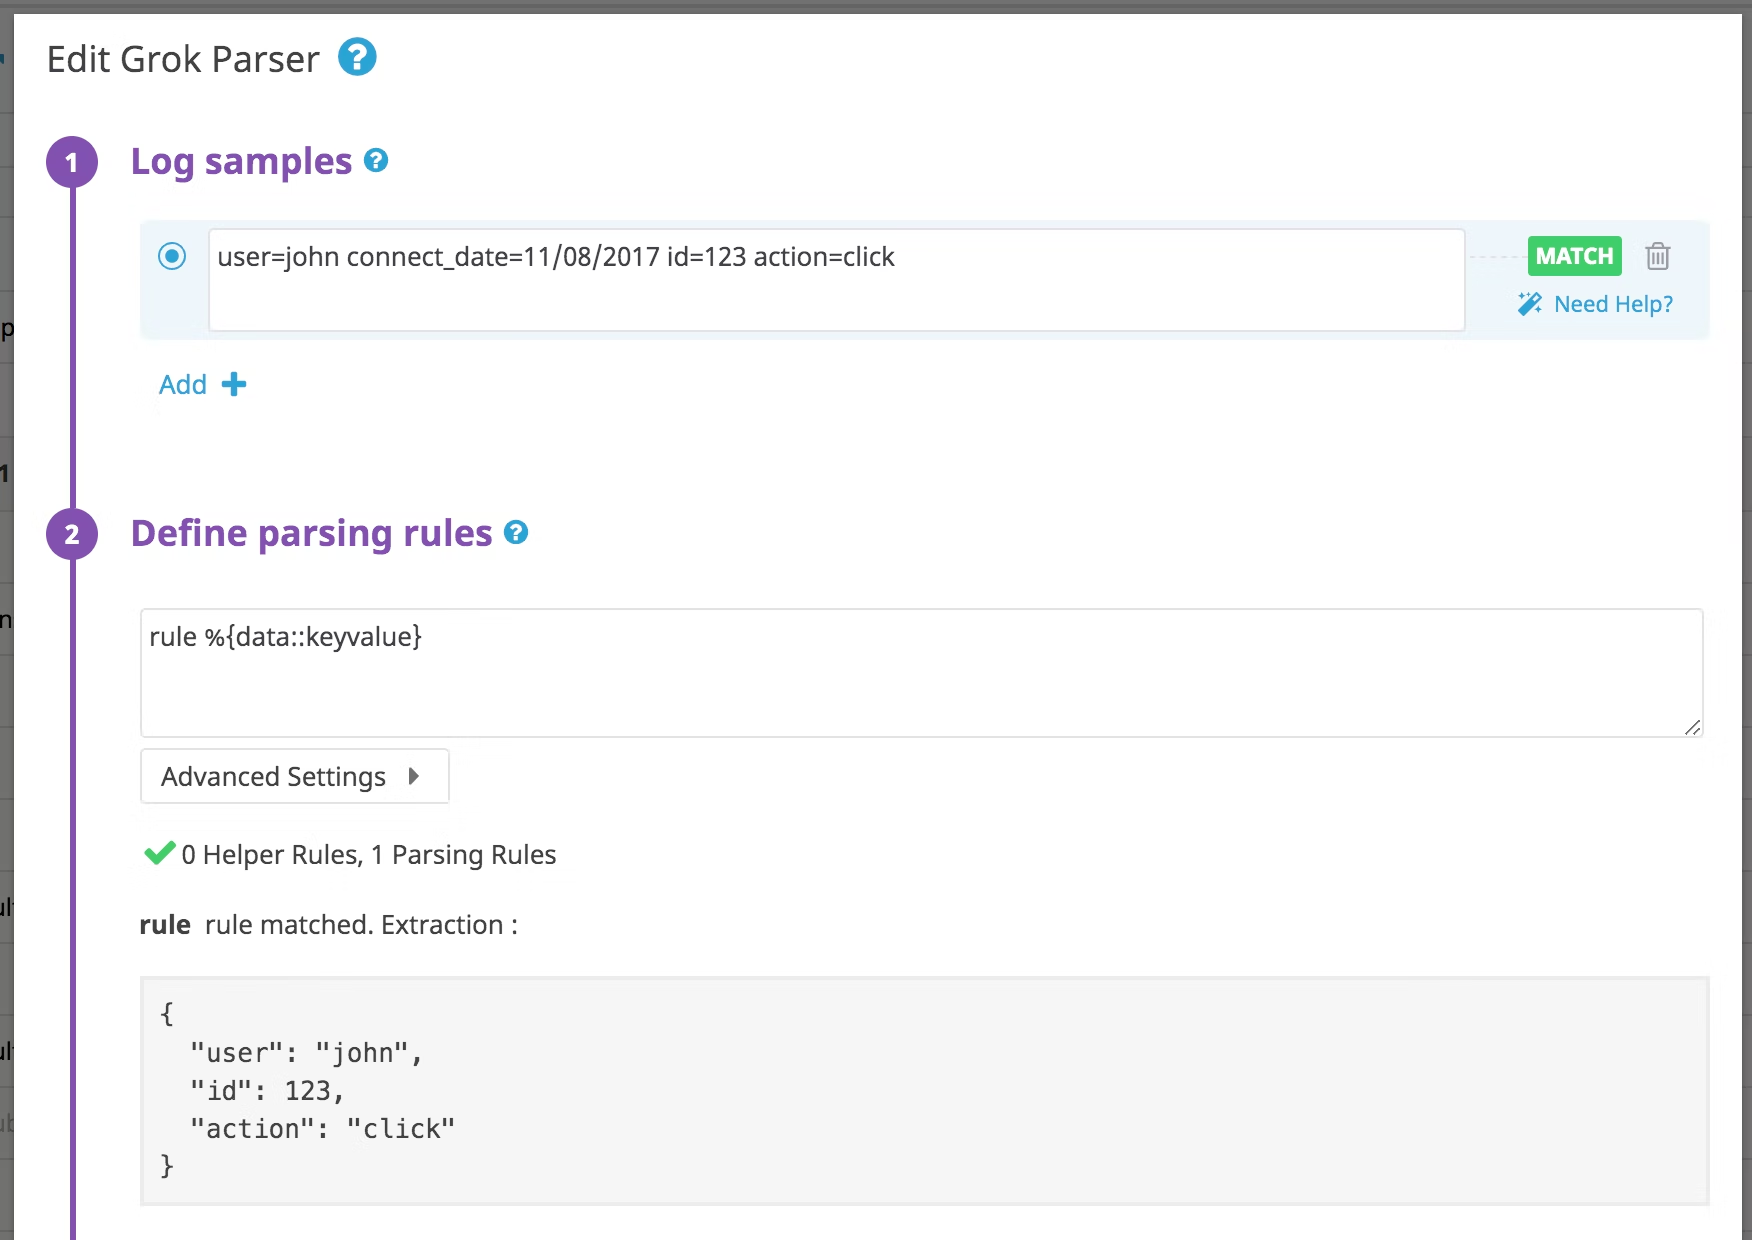
You can see that the parsing rule used here is:
rule %{data::keyvalue}
This will use data as a matcher (which means it matches any string including spaces and new line like a .* in regex),
then it will parse the data as keyvalue, so keys seperated by an = to a value will be considered as attributes.
The rule can be modified for example, you can explicitly specify which separator you have for your keyvalue parser.
We’re still using data, but you can refer to the documentation for more specific data types like numbers, date, host…
# Using this rule will transform the message
rule %{data:user:keyvalue("=")}
As an example for the message seen in the image that is = separated, using the above rule will transform
it into a json object:
# into this json object
{
  "user": {
    "user": "john",
    "id": 123,
    "action": "click"
  }
}
Now you can see that we have added one level as user in the output, but user.user would be better as user.name,
that’s where you can use a remapper to change the name.
Remapper
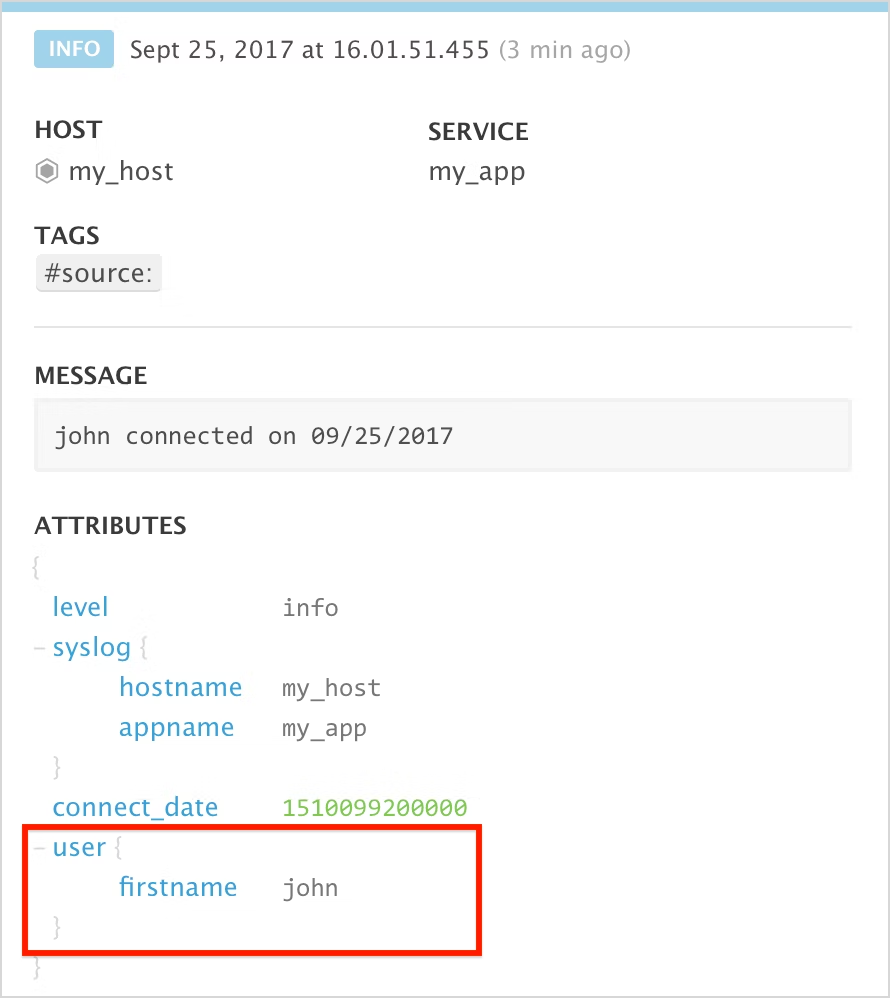
The remmapper processor does exactly that, it takes the source attribute path, then you set the target attribute path. By adding the processor after the previous one you can modify the parsed attributes you have created.
It should show up in the log explorer:
You can also use the remapper if your JSON logs are using different attributes than the recognized ones for the message,
the date, status and service. For example if you had called msg instead of message for your log’s message, you won’t
see it properly unless you set it up correctly with the remapper.
Facets
They are attributes that you’ve defined with your log processor (some are there by default). Now that they’ve been created, you can index them on ingestion by datadog so that you can search for them in the log explorer.
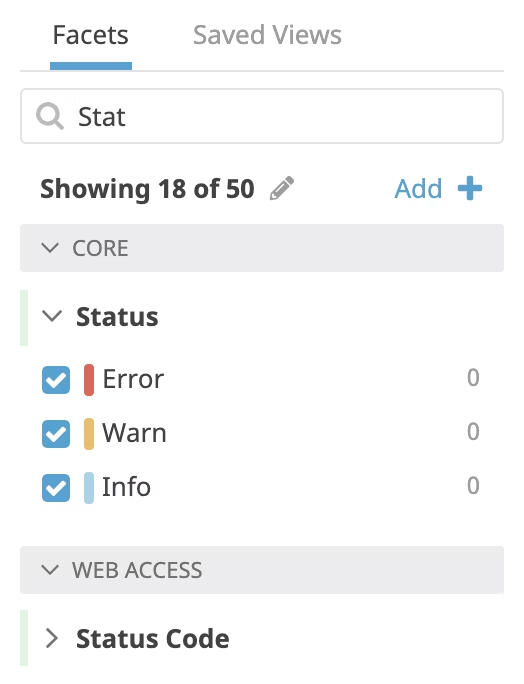
To add a new facets click on the Add + in the log explorer near the default facets, this will prompt you with a window
to search and add one from the existing attributes. If you have just created the attribute you may have to wait a bit
for an actual log to be processed for datadog to register them.
Once you have added the facet you can start searching for it in the free text filter. Now you can use datadog’s search
capabilities to look for what you need. (example *john* for any firstname having john in it).