D3.js
Introduction
D3.js is a javascript library developed by Mike Bostock (which was
very proficient, giving a lot of examples). It basically uses an HTML <div> to create a SVG and use javascript to draw
and update the svg components. You dynamically create those elements within a pre-defined canvas and those elements can
be customized via CSS.
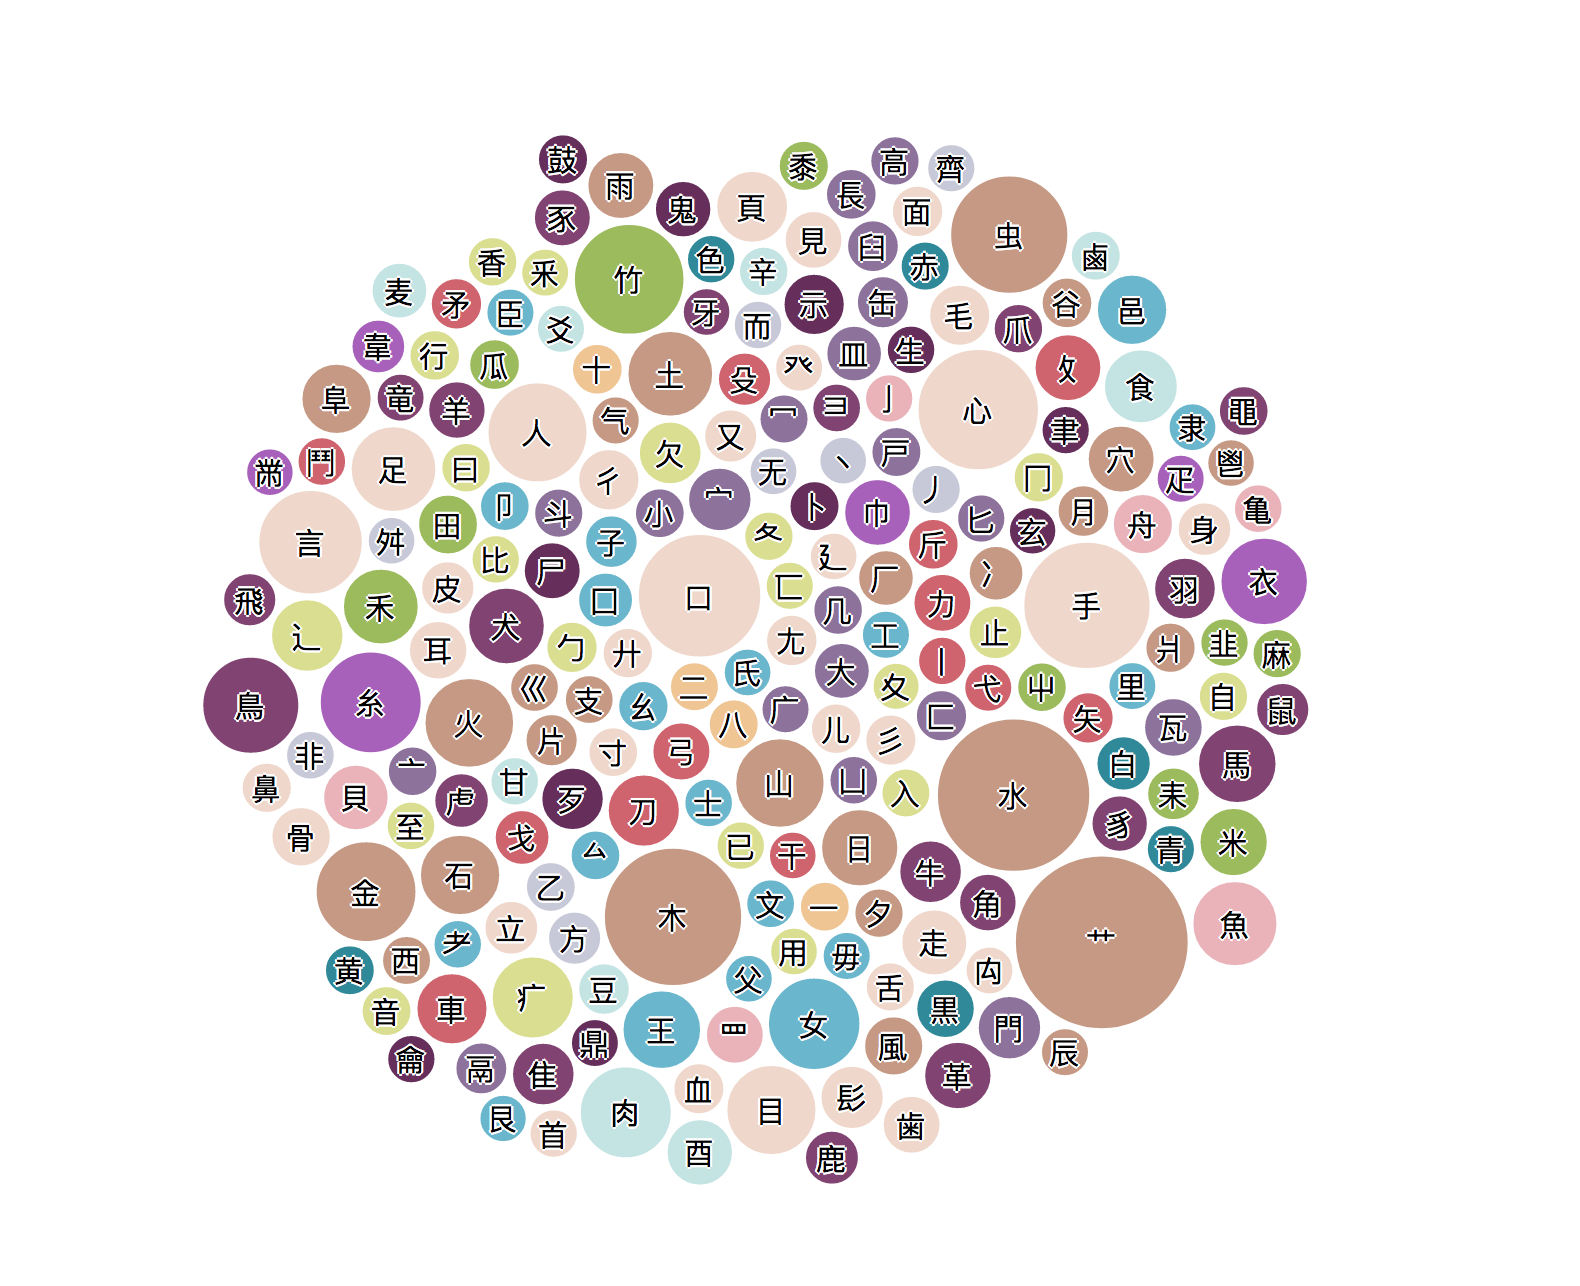
I used it for a graph network of kanji bubbles sylhare/kanji:
When I was saying that author Mike Bostock was very proficient, you can check all of his examples on:
- bl.ocks.org - with mostly example for D3.js of v3, v4
- observablehq.com - with example of D3.js from v4+
- bost.ocks.org/ - his personal website which redirects to the above link
With each new version of D3.js the syntax can change a bit (even though the overall logic stays similar). It can be quite confusing looking at some example, not knowing how to “translate” it from one version to another. Here I use ** D3.js v4**, it provided a good amount of examples and was not the oldest.
Check D3 in Depth to learn it.
Basic structure
The whole process is called a simulation, for the node graph:
- you give the data (nodes, links between those nodes)
- you set the layout of those elements (css, svg, other attributes …)
- you set some constraints (force, gravity, …)
- you may add some other logic or added components to it
And then you run the simulation which will make the system move.
Examples
For these examples I’ve got inspired by all those talented people on the internet that provided cool examples. If you have one other site to check that was no mentioned before, I’d recommend Yan Holtz which provides amazing and simple examples at d3-graph-gallery.com
With data
You create a svg within the div of id “d3example” with defined height and width
var svg = d3.select("#d3example")
    .append("svg")
    .attr("width", width)
    .attr("height", height);
Then you can load the nodes from the your example data (a json). You put all the elements in the svg group “g” and select all nodes from that data.
var exampleData = [{ "name": "A" }, { "name": "B" }, { "name": "C" }, { "name": "D" }];
var node = svg.append("g")
    .selectAll("nodes")
    .data(exampleData)
    .enter();
You append a svg circle object to each of the node, and specify some svg attributes We put the coordinates to some random numbers inside our canvas:
var circles = node.append("circle")
      .attr("cx", () => {return Math.random() * width})
      .attr("cy", () => {return Math.random() * height})
      .attr("r", 40)
      .style("fill", rgb(239, 192, 80))
If you want to look at how the HTML is constructed, click on Details to expand the html. Basically
like: div > svg > g > circle
Details
<div id="d3example">
    <svg width="450" height="450">
        <circle cx="225" cy="225" r="40" style="fill: rgb(239, 192, 80)"></circle>
        <circle cx="..." cy="..." r="40" style="fill: rgb(239, 192, 80)"></circle>
    </svg>
</div>
Miscellaneous
Some other things you may want to know using d3.js
Transition
You can transition to ease the update using the d3.transition() method:
var t = d3.transition().duration(750);
Then you can use this transition on the nodes to make their attributes transitioned from their current state to their desired state.
// the node will shrink (transition) to a radius of 1e-6 then disappear
node_up.exit()
    .transition(t)
    .attr("r", 1e-6)
    .remove();
Interval
When you want to update your canvas at a set interval. You may use another d3 method called d3.interval() which works as a timeout:
d3.interval(() => restart(randomizeData()), 2000);
Here it will restart with random data the simulation every 2000 seconds
Colors
You can use d3 automatic colors for your nodes using d3-scale-chromatic, it provides a lot of flexibility.
const d3Color = d3.scaleOrdinal(d3.schemeCategory20);
d3Color(Math.random())
It uses scaleOrdinal that creates a colour scale using a colour scheme (that I’m just using randomly for demo).
Other examples
You can check some other examples here: