The Apache JMeter™ application is open source software, a 100% pure Java application designed to load test functional behavior and measure performance. It was originally designed for testing Web Applications but has since expanded to other test functions.
Installation
With mac, to install apache JMeter:
brew install jmeter
Configuration
Variable
JMeter files can leverage variables in order to update your load test on the fly:
${__P(host, localhost)}
Here I am defining the variable host with a default value of "localhost".
This variable can be overwritten in the command line using:
jmeter -n -t LoadTestJmeterScript.jmx -Jhost=192.168.0.1
So that the host will be 192.168.0.1 during the load test. You can define all of your default variable within a TCP Sampler Config that will apply on all the subsequent Sampler. Also you can configure your Thread Group number of Thread and duration adding variables to it. When using with duration you should use “Infinite Loop”.
Create your Sampler
You can find excellent tutorial on Blazemeter or Dzone with screenshot and detailed examples. There some options available in your Sampler:
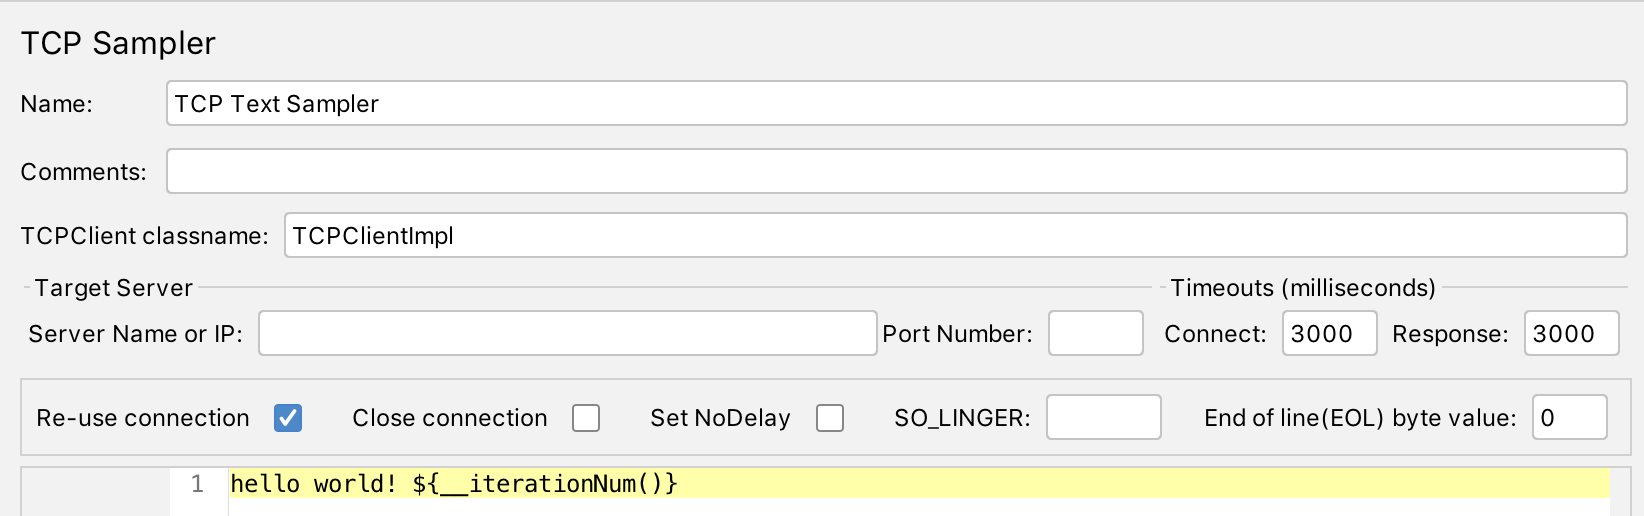
- The timeout parameter:
- Connect: max time in ms for the Sampler to wait for the connection to be established.
- Response: max time the sampler will wait for a response from the request.
- The other connection parameters:
- Re-use connection: To re use the same connection previously established to send data
- Close connection: To open and close the connection each time it sends data.
- Set NoDelay: When set small messages, even those the size of only 1 byte, are sent in a separate packet. Otherwise, if this parameter is cleared, a number of small messages is combined in one packet before sending them.
- SO_LINGER: This option can be enabled in the socket to cause the script to block the close the connection call for a number of seconds, specified in this field, until all final data is delivered to the destination station.
- EOL byte value: Tells which is the last byte to expect (So it knows when it got all of the response, otherwise it will timeout with Error: 500)
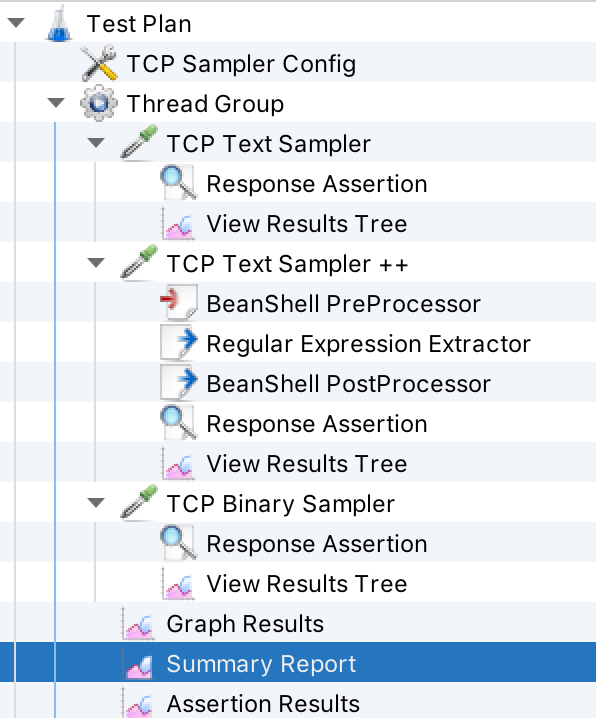
You can add a TCP Sampler and then add some other things to it like:
- Response Assertion: To assert on the response data of the request (Because TCP does not return HTTP - 200, you need to add something to say when it’s a success)
- View Results Tree: To check what has been send and received for the particular sampler
- BeanShell PreProcessor: To custom the request you are going to send (Uses BeanShell syntax)
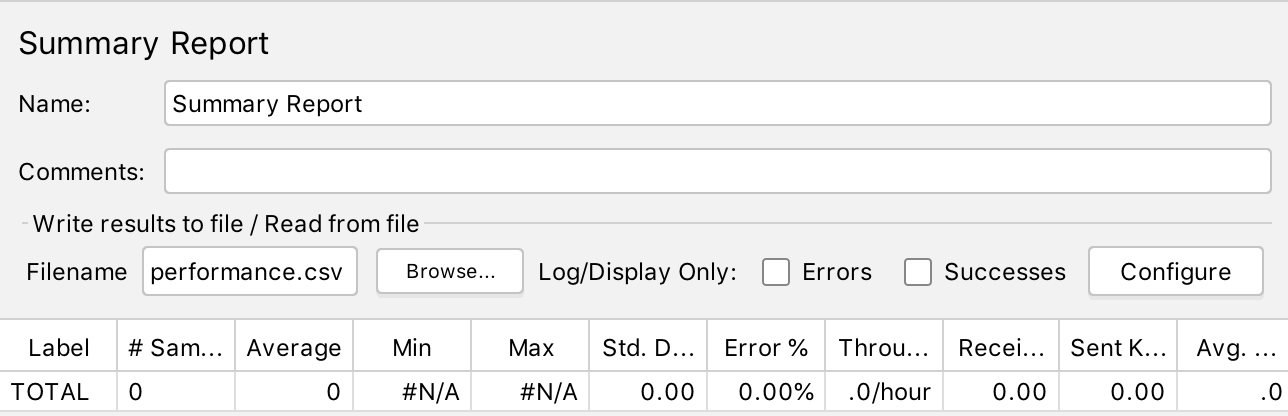
If you want the combined results of your Thread Group. You will want to use a Summary Report. Add a filename to it like “performance.csv” so it will be generated at each run.
You can add other Listeners to your Thread Group for assertions or even a graph. To generate a report, see the command line in the next section.
Usage
Run the load test for 100 tps:
jmeter -f -n -t LoadTestTcp.jmx -Jthreads=100 -Jhost=localhost -Jport=5556 -l output.jtl
The result of the load test will be saved:
- in
output.jtlfor the load test values - in
jmeter.logfor the logs of jmeter - in
performance.csvfor the csv with all of the requests (a bit like the output.jtl)
To turn the csv/jtl file into an html in the report folder, use:
jmeter -g output.jtl -o report
jmeter -g performance.csv -o report
This will generate a report that you can open in your browser.
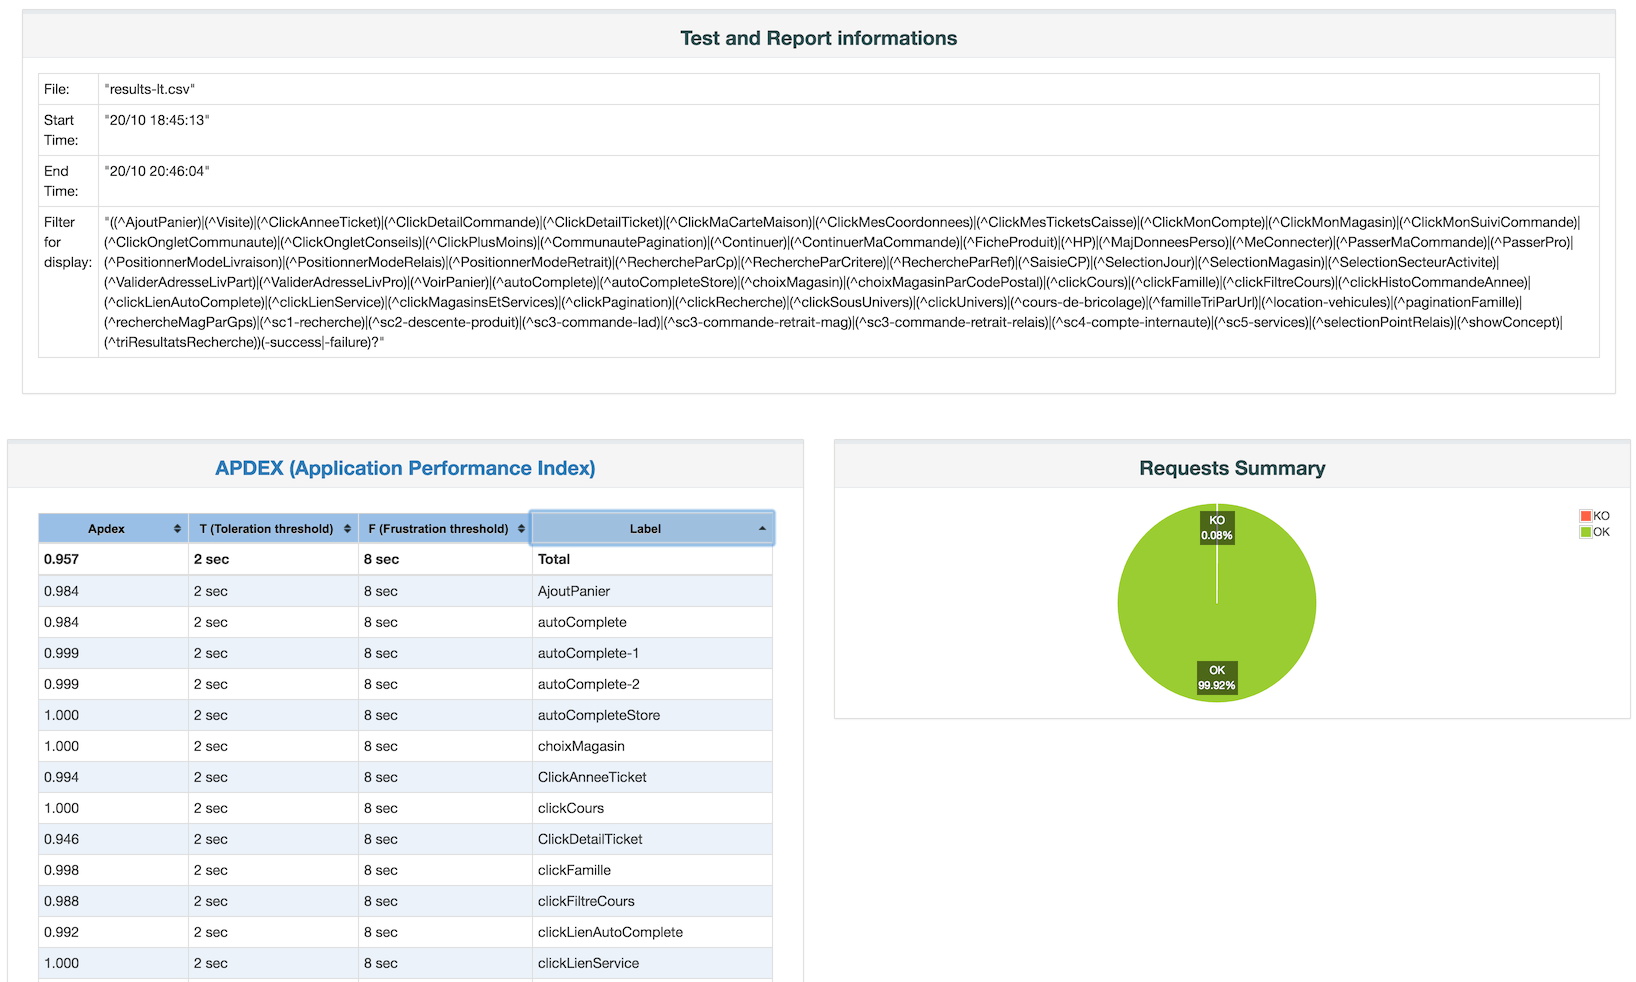
You will get access to all the information you need (timestamp, transaction/s, request average or median time, results, etc …)